CellChat_spatial
Preface
IMPORTANT
CellChat is an R toolkit for inferring, analyzing, and visualizing cell-cell communication in single-cell and spatial transcriptomics data. CellChat_spatial is a core function of CellChat v2, specifically designed for spatial transcriptomics data. By integrating spatial distance information, it infers spatially proximal communication between cells, providing a powerful tool for understanding cell interactions in tissue microenvironments.
In spatial transcriptomics research, cells not only communicate through secreted signaling molecules, but their spatial positional relationships also have important impacts on cell-cell interactions. CellChat_spatial can identify spatially proximal cell-cell communication by integrating gene expression data and spatial coordinate information, revealing cell interaction networks in tissue microenvironments.
Core Functions of CellChat_spatial
- Spatially Proximal Communication Inference: Identifies spatially proximal ligand-receptor interactions based on cell spatial distance.
- Multi-Sample Comparative Analysis: Supports comparison of cell communication networks between multiple spatial samples.
- Signal Pathway Analysis: Identifies key signal pathways and their transmission between different cell types.
- Rich Visualization: Provides various visualization methods such as circle plots, chord plots, bubble plots, heatmaps, etc.
- Spatial Factor Settings: Supports custom communication distance thresholds, adapting to different spatial transcriptomics technologies.
This document aims to provide spatial transcriptomics researchers with a comprehensive CellChat_spatial technical guide, covering its basic principles, operation methods on SeekSoul™ Online, result interpretation, practical cases, and common questions, helping you quickly master and apply this tool.
CellChat_spatial Theoretical Foundation
The core idea of CellChat_spatial is: by integrating gene expression data and spatial position information, using the law of mass action to model ligand-receptor-mediated cell-cell communication, and considering the impact of spatial distance on communication. This process can be summarized into the following main steps:
- Differential Expression Gene Identification: Uses Wilcoxon rank-sum test to identify differentially expressed signaling genes in different cell groups.
- Ensemble Average Expression Calculation: Calculates average expression levels of ligands and receptors in each cell group.
- Spatial Distance Integration: Calculates Euclidean distance between cells based on cell spatial coordinates.
- Communication Probability Calculation: Uses the law of mass action, combined with spatial distance factors, to calculate the probability of ligand-receptor interactions.
- Statistical Significance Testing: Evaluates the statistical significance of cell-cell communication through permutation tests.
SeekSoul™ Online Operation Guide
On SeekSoul™ Online, the CellChat_spatial analysis workflow is designed to be intuitive and easy to use. You don't need to write code, just complete the analysis through the parameter configuration interface.
Preparation Before Analysis
IMPORTANT
The success of CellChat_spatial analysis largely depends on the quality of input data and the accuracy of spatial information. Before starting the analysis, please ensure:
- Data has been preprocessed: Your spatial transcriptomics data has undergone standard quality control, dimensionality reduction, clustering, and cell type annotation.
- Spatial coordinate information is complete: Ensure each cell or spot has accurate spatial coordinate information (stored in spatial dimensionality reduction).
- Cell type annotation is accurate: The accuracy of cell type annotation directly affects cell communication analysis results.
- Sample selection is reasonable: It is recommended that each sample contains at least 1000 cells/spots, and each cell type has at least 10 cells.
Parameter Details
The following table details the main parameters and their descriptions of the SeekSoul™ Online CellChat_spatial analysis module.
| Interface Parameter | Description |
|---|---|
| Task Name | Name of this analysis task, must start with English letters, can contain English letters, numbers, underscores, and Chinese. |
| Species | Select the species name corresponding to the data in this analysis workflow. Currently supports human, mouse, and zebrafish. |
| Grouping.by | Column name in meta, such as CellAnnotation, used to specify cell type annotation column, required. |
| Cell Type | Objects corresponding to the col_celltype column in meta, multiple selection, select cell types to analyze, required. |
| Method | Calculation method, optional triMean or truncatedMean. triMean yields fewer but stronger interactions; truncatedMean yields more interactions. Spatial data is recommended to use truncatedMean. |
| Ratio | Only used when the analysis method is truncatedMean. When the expression proportion is below a certain percentage, the gene expression mean is considered 0. Single-cell transcriptomics defaults to 0.25, spatial data is recommended to be set smaller, such as 0.1. |
| Min.cells | When cell number is below this value, filter out this cell type. Default is 10, recommended to set between 10-20. |
| Downsample | Whether to sample for analysis. When data volume is too large (e.g., > 50,000 cells), it is recommended to set to True to speed up analysis. |
| Downsample_num | Downsample number, required when downsample is True. It is recommended to set to at least 100 cells per cell type. Default is 1000. |
| Group.by | Column name in meta, such as Sample. Used to specify sample grouping column, used together with "Comparison Object", required. |
| Group Names | Comparison objects corresponding to the col_sam column in meta, multiple selection, select sample names to analyze, required. |
| Notes | Custom note information, can be used to record reasons for analysis parameter settings or special instructions. |
Important Notes
CAUTION
- Spatial Coordinate Requirements: Ensure spatial coordinate information is accurate and complete. CellChat_spatial requires coordinate information in spatial dimensionality reduction.
- Cell Number Requirements: Each cell type requires at least 10 cells, otherwise it may cause analysis failure or unreliable results.
- Memory Limitations: If the number of cells analyzed is too large (> 50,000), it is recommended to use the Downsample function.
- Analysis Time: CellChat_spatial analysis is time-consuming, large datasets may take several hours to complete.
TIP
Parameter Tuning Recommendations:
- Initial analysis is recommended to use default parameters.
- If interaction count is too low, you can lower the trim value or change triMean to truncatedMean.
- If interaction count is too high and noise is large, you can increase the trim value or use triMean method.
- You can filter low cell number types by adjusting the mincell parameter.
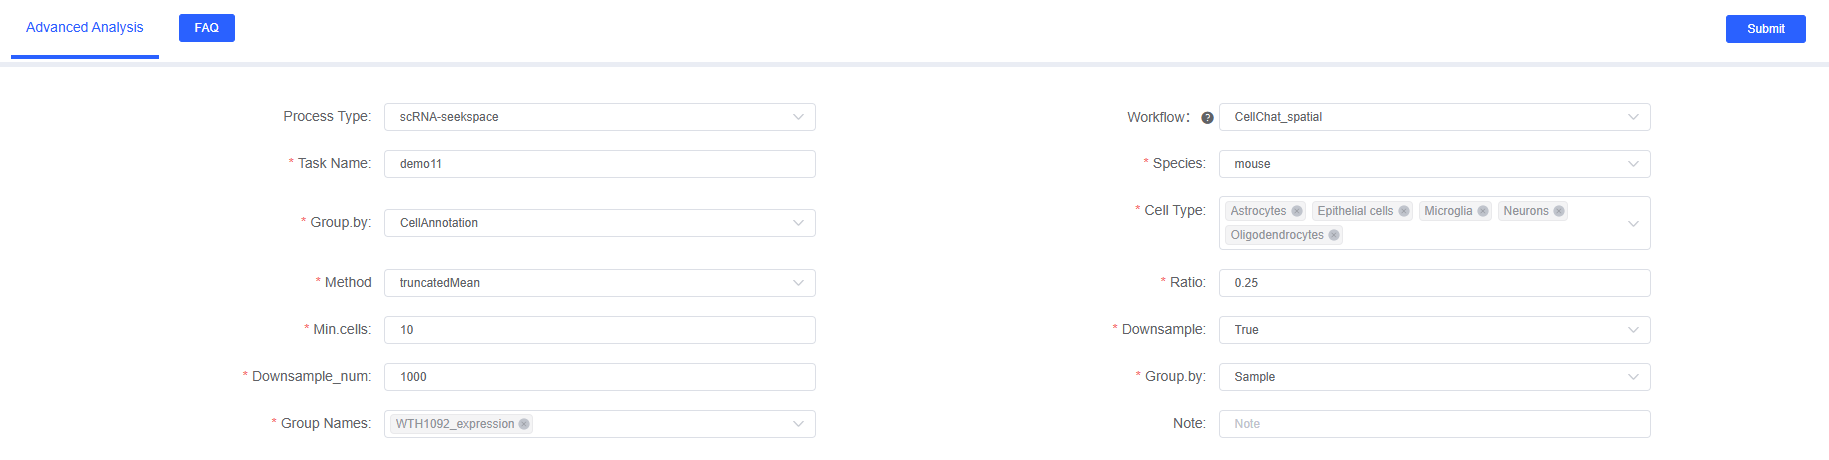
Operation Workflow
- Enter Analysis Module: Navigate to the "Advanced Analysis" module on SeekSoul™ Online and select "CellChat_spatial".
- Create New Task: Name your analysis task and select the project to analyze.
- Configure Basic Parameters
- Select species.
- Set grouping factor and cell types.
- Select analysis method and expression proportion.
- Configure Filter Parameters
- Set minimum cell number.
- Set Downsample parameters as needed.
- Configure Sample Parameters
- Set grouping comparison column name.
- Select samples to analyze.
- Submit Task: After confirming that parameters are correct, click the "Submit" button and wait for the analysis to complete.
- Download and View: After the analysis is complete, download and view the generated analysis reports and result files in the task list.
Result Interpretation
CellChat_spatial's analysis report contains rich charts and data files. The following is a detailed interpretation of the core results.
Result File List
| File Name | Content Description |
|---|---|
*_netVisual_circle.pdf/png | Circle plot of interaction numbers and interaction strength between cells |
*_netVisual_circle_split_weight.pdf/png | Communication strength circle plot for each cell type (split by cell type) |
*_netVisual_circle_split_count.pdf/png | Interaction count circle plot for each cell type (split by cell type) |
*_netVisual_chord_LR.pdf/png | Ligand-receptor pair chord plot |
*_netVisual_chord_path.pdf/png | Signal pathway chord plot |
*_netVisual_bubble.pdf/png | Cell-cell ligand-receptor pair bubble plot |
*_roles_scatter.pdf/png | Cell communication role scatter plot |
*_outgoing_roles_heatmap.pdf/png | Outgoing signal heatmap |
*_incoming_roles_heatmap.pdf/png | Incoming signal heatmap |
*_netVisual_embedding.pdf/png | Spatial position communication visualization plot |
*.rds | CellChat object RDS file (can be used for subsequent analysis) |
*_LR_pair.xls | Ligand-receptor pair detailed information table |
*_pathway.xls | Signal pathway detailed information table |
Cell-Cell Interaction Count and Interaction Strength Circle Plot
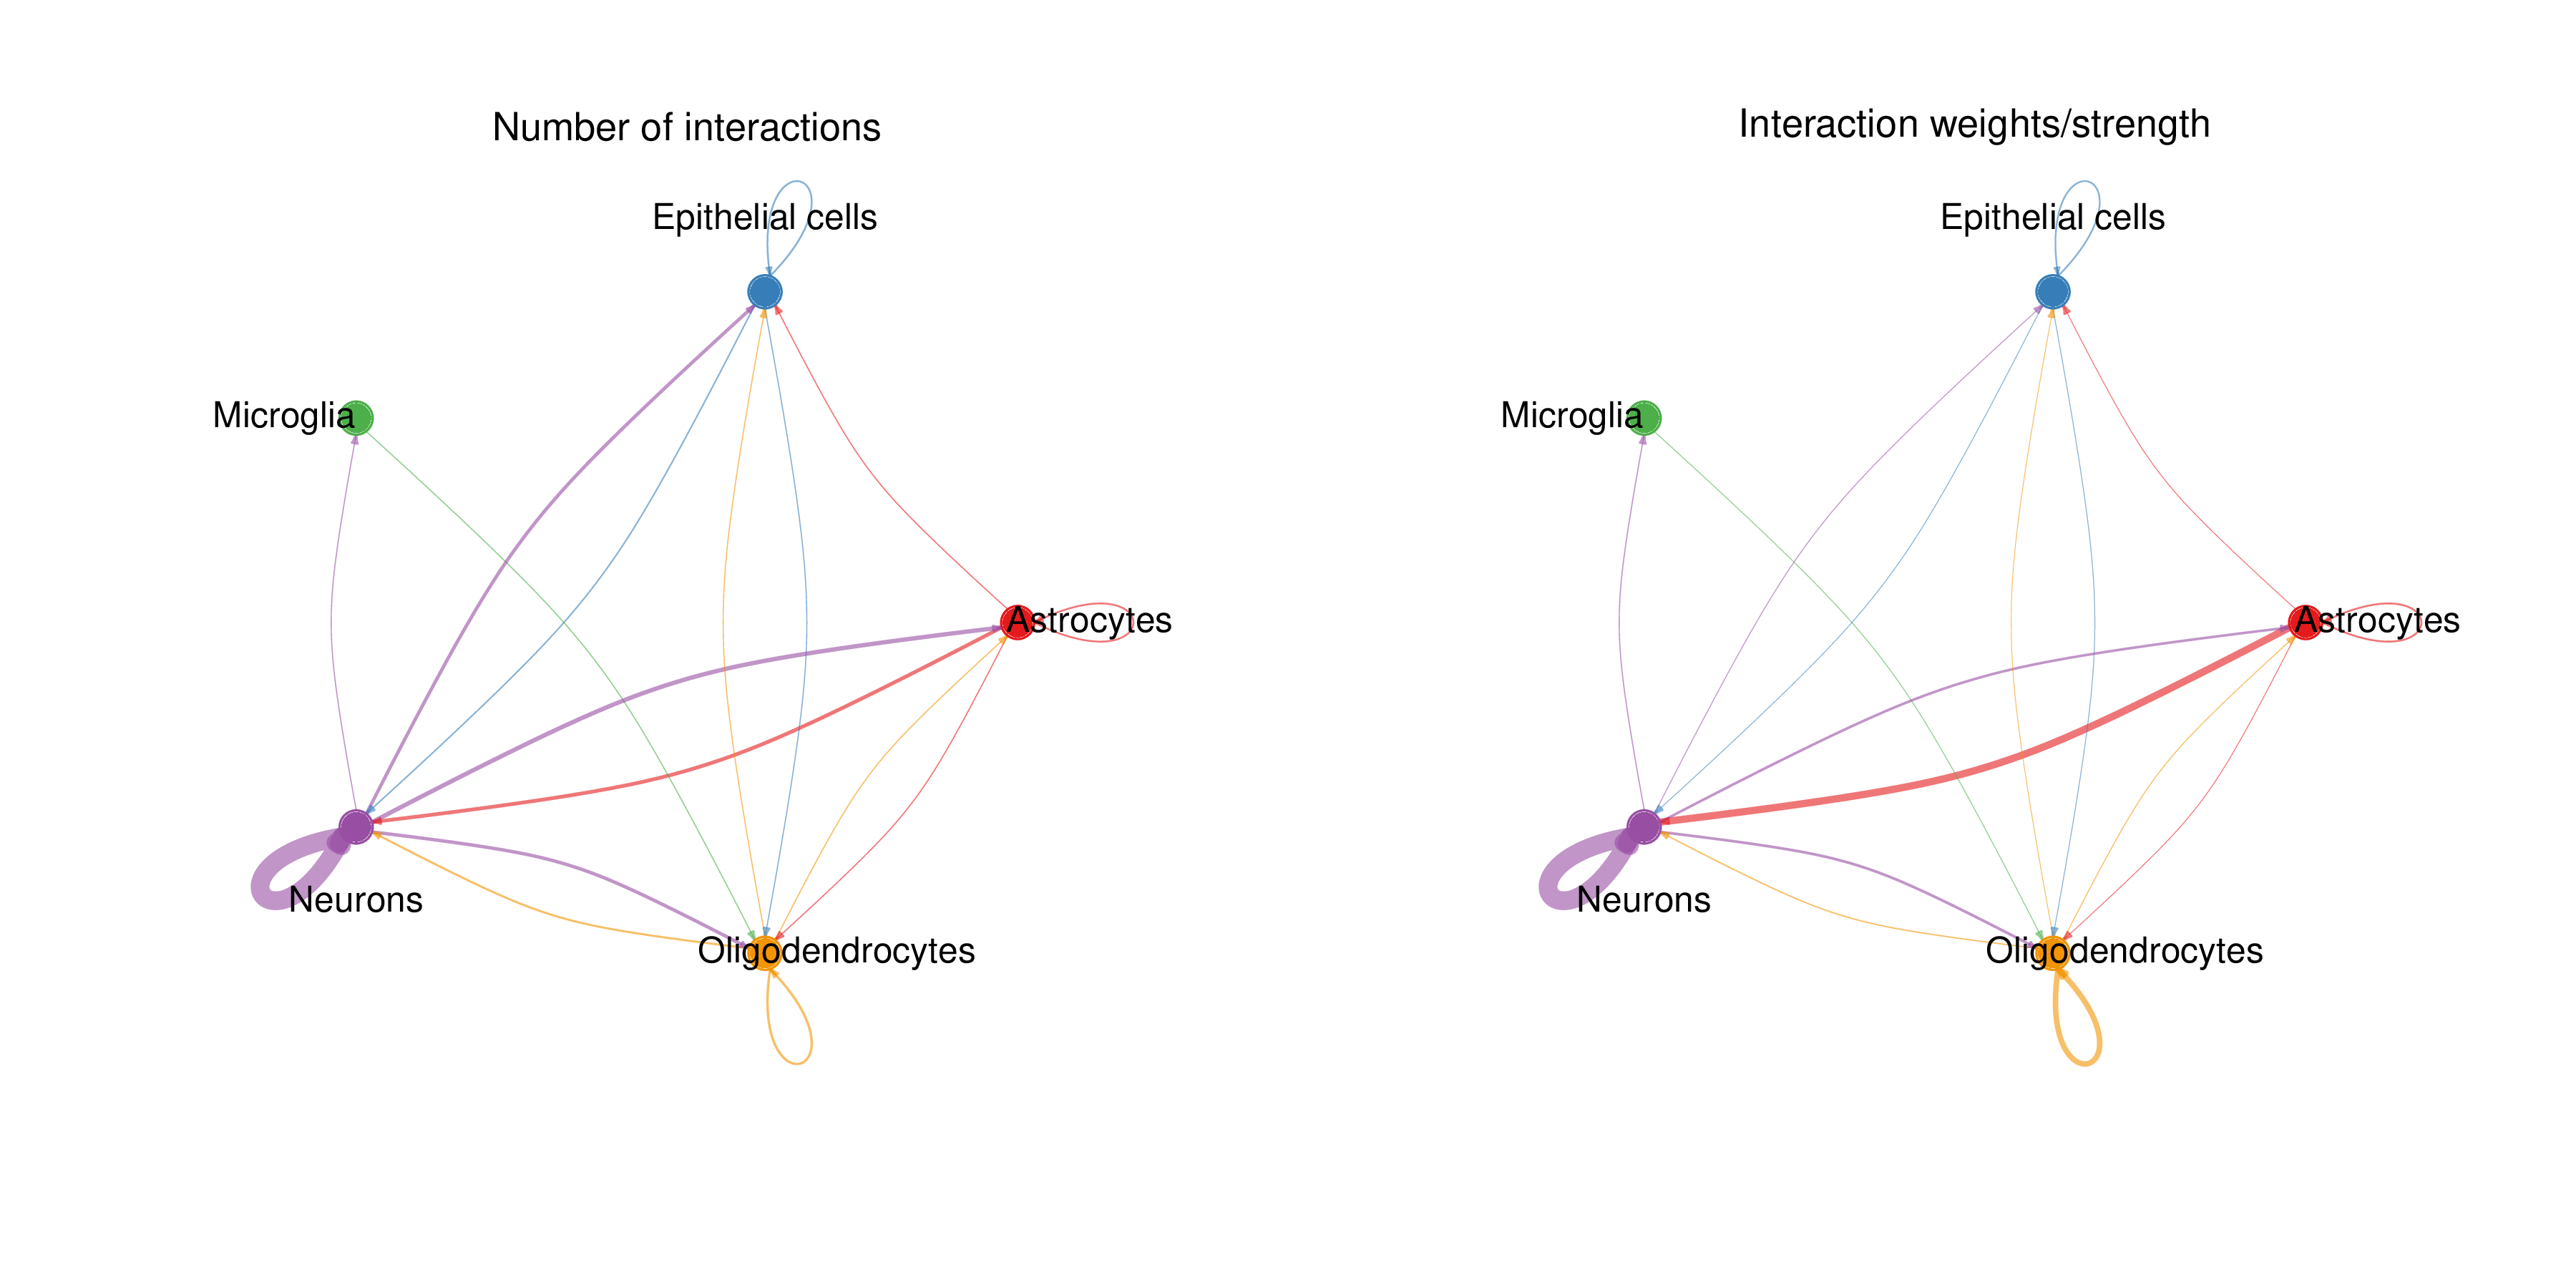
Chart Structure
- Left Plot: Displays interaction numbers between cell types (Number of interactions).
- Right Plot: Displays interaction strength between cell types (Interaction weights/strength).
Graphical Elements
- Solid Circles: Different colors represent different cell types.
- Circle Size: Proportional to the cell number of that cell type.
- Connecting Lines (Edges):
- Color matches the signal sender (ligand-expressing cells).
- Thickness is proportional to interaction count/strength.
- Arrows point to signal receivers (receptor-expressing cells).
Interpretation Points
- Strong Interactions: Thick lines indicate strong communication between cell types.
- Interaction Direction: Observe which cell types mainly act as signal senders and which as receivers.
- Interaction Network: Overall observation of the cell communication network topology in the tissue.
Ligand-Receptor Pair Chord Plot
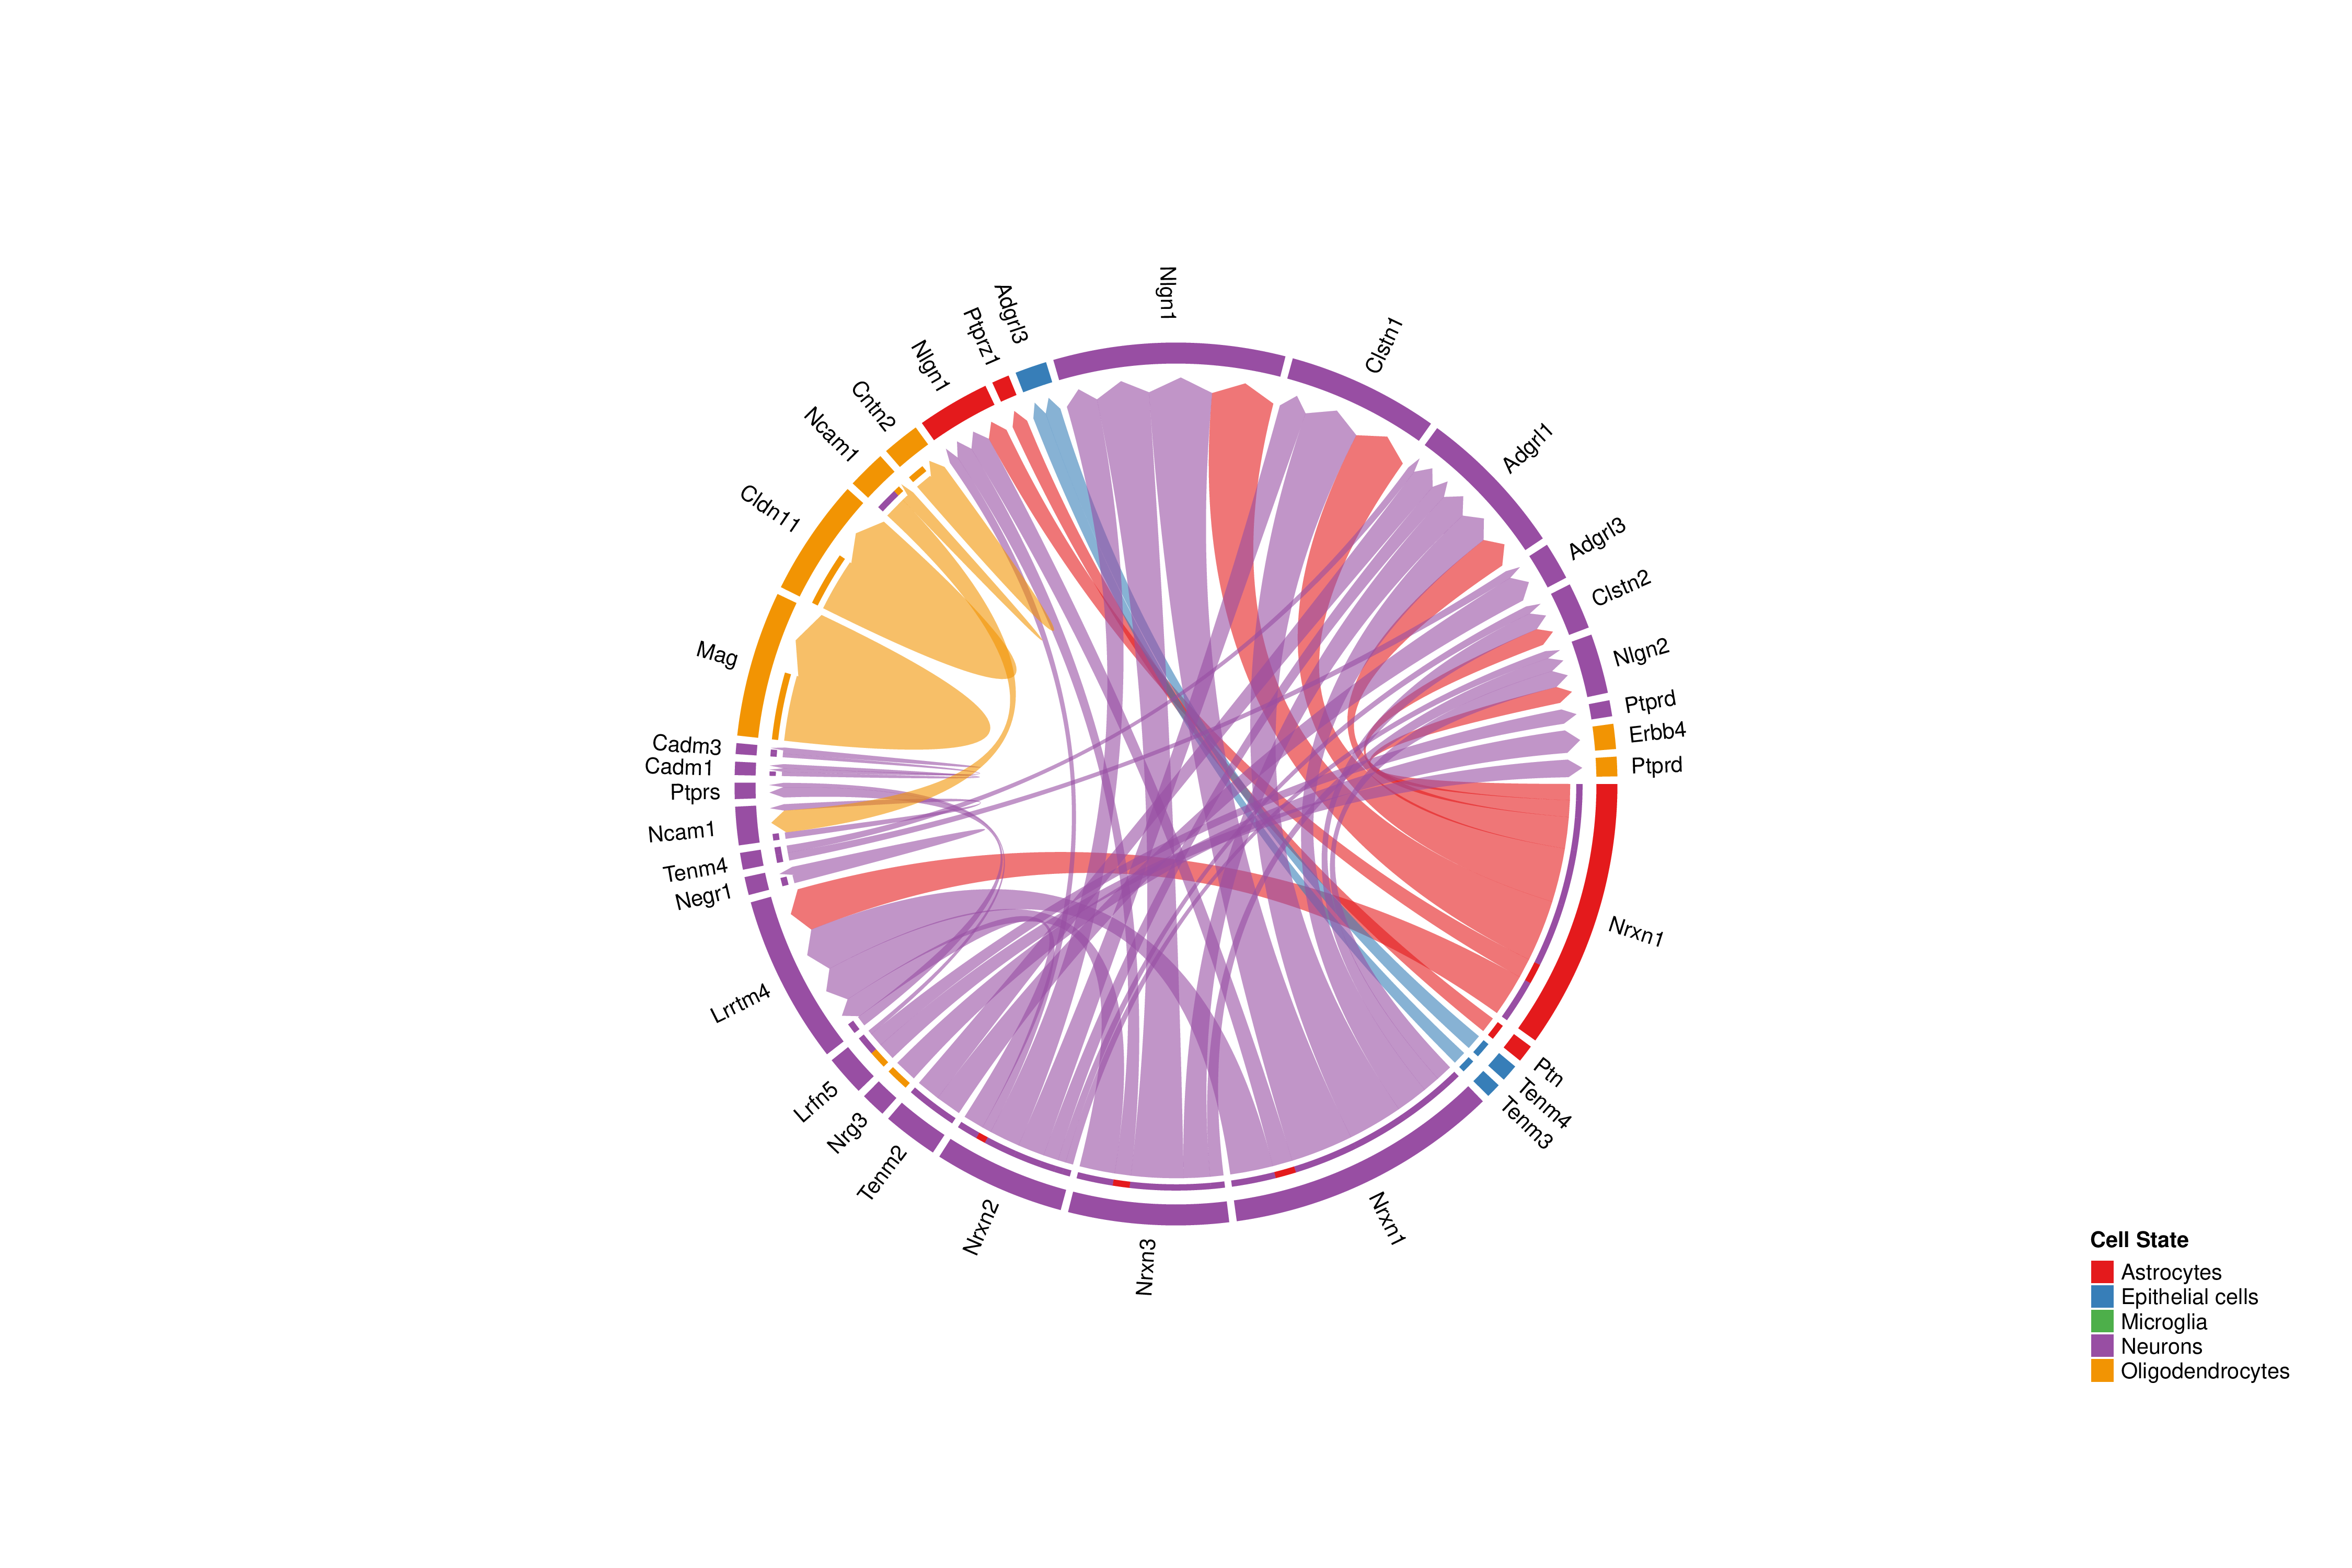
Chart Structure
- Outer Ring: Each segment represents a ligand or receptor gene.
- Arcs: Connect ligands and receptors, indicating interactions between them.
- Color: Arc color matches the signal sender cell type.
Interpretation Points
- Main Ligand-Receptor Pairs: Wider arcs indicate higher communication probability for that ligand-receptor pair.
- Many-to-Many Relationships: One ligand may interact with multiple receptors, and vice versa.
- Cell Specificity: Observe ligands or receptors expressed in specific cell types.
- Communication Direction: Arcs point from ligands to receptors.
Chord plots only show ligand-receptor pairs with significant communication probability (p < 0.05). If some expected interactions are not displayed, it may be because their statistical significance did not reach the threshold.Cell Communication Role Scatter Plot
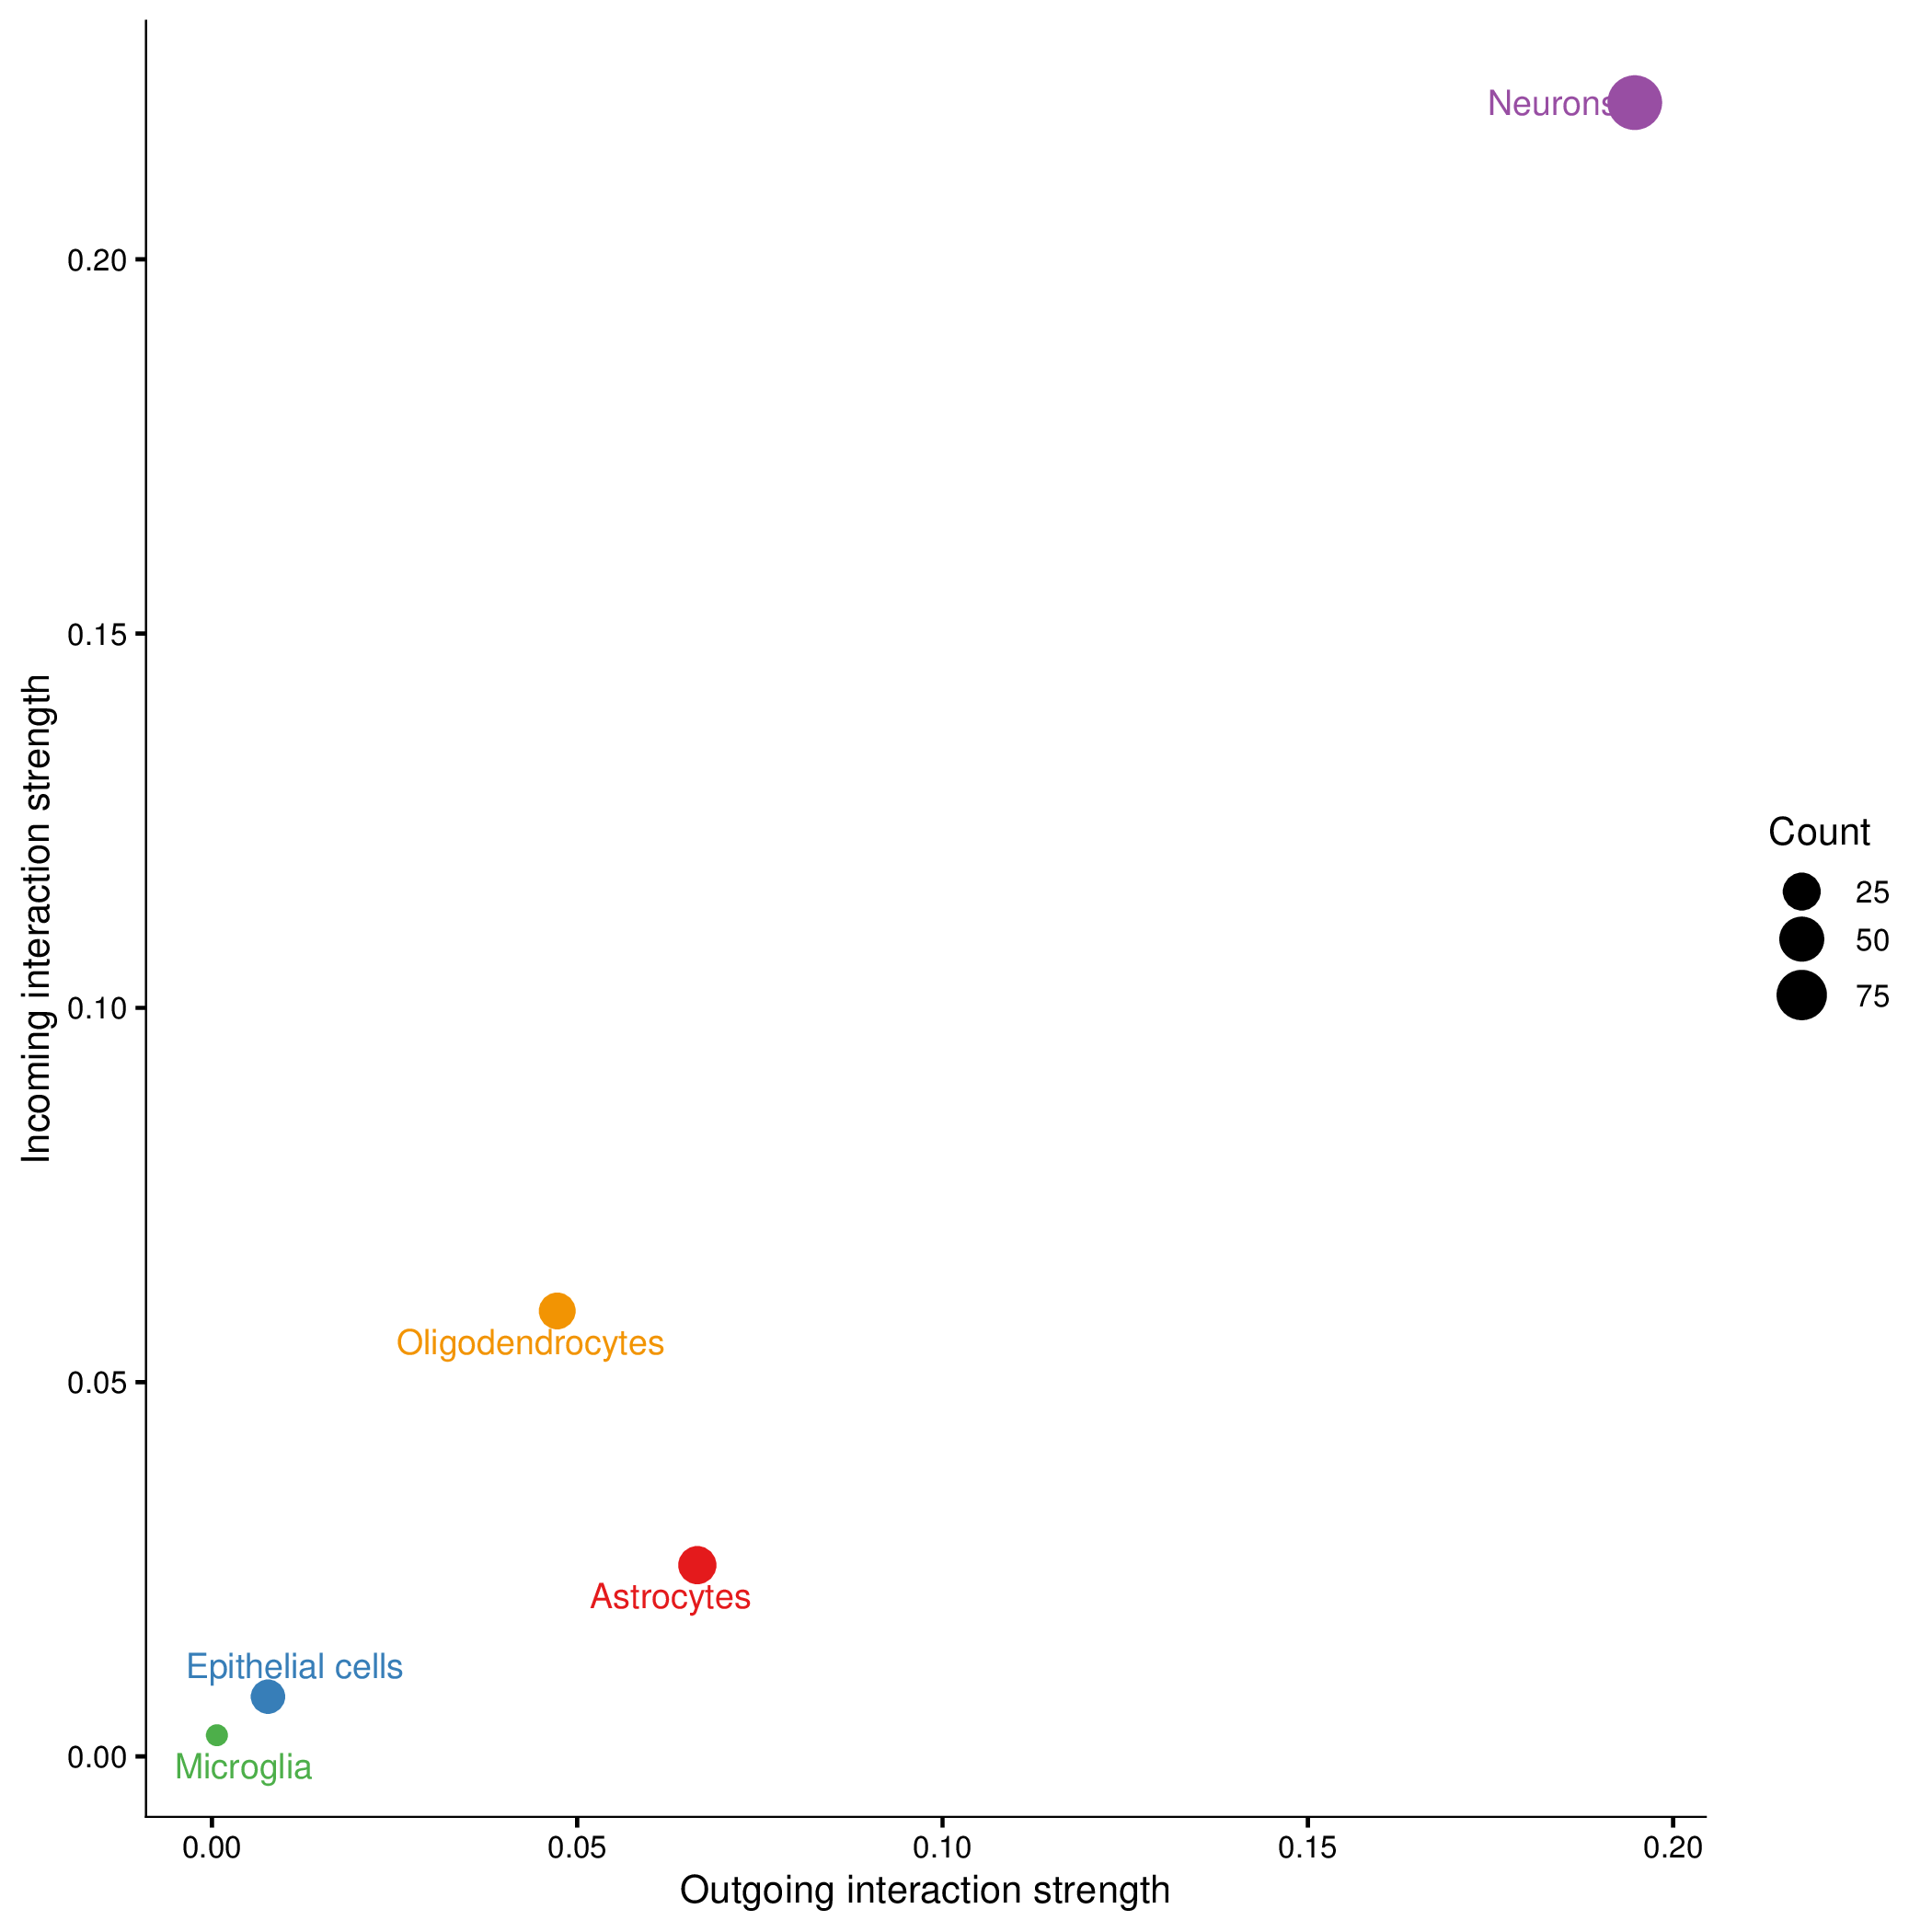
Chart Structure
- X-axis: Outgoing communication strength.
- Y-axis: Incoming communication strength.
- Point Size: Number of communications this cell type participates in (including outgoing and incoming).
- Point Color: Different cell types.
Cell Role Classification
a. Signal Sender
- Characteristics: Large X-axis coordinate, small Y-axis coordinate.
- Biological Significance: Mainly acts as signal source, sending signals to other cells.
- Examples: Endocrine cells, neurons, etc.
b. Signal Receiver
- Characteristics: Small X-axis coordinate, large Y-axis coordinate.
- Biological Significance: Mainly receives signals from other cells.
- Examples: Target organ cells, effector cells, etc.
c. Mediator
- Characteristics: Both X-axis and Y-axis coordinates are large.
- Biological Significance: Both receives and sends signals, acts as a bridge in the communication network.
- Examples: Immune cells, fibroblasts, etc.
d. Bystander
- Characteristics: Both X-axis and Y-axis coordinates are small.
- Biological Significance: Low participation in cell communication networks.
- Possible Reasons: The main function of this cell type does not depend on cell-cell communication, or data quality issues.
Signal Pathway Heatmap
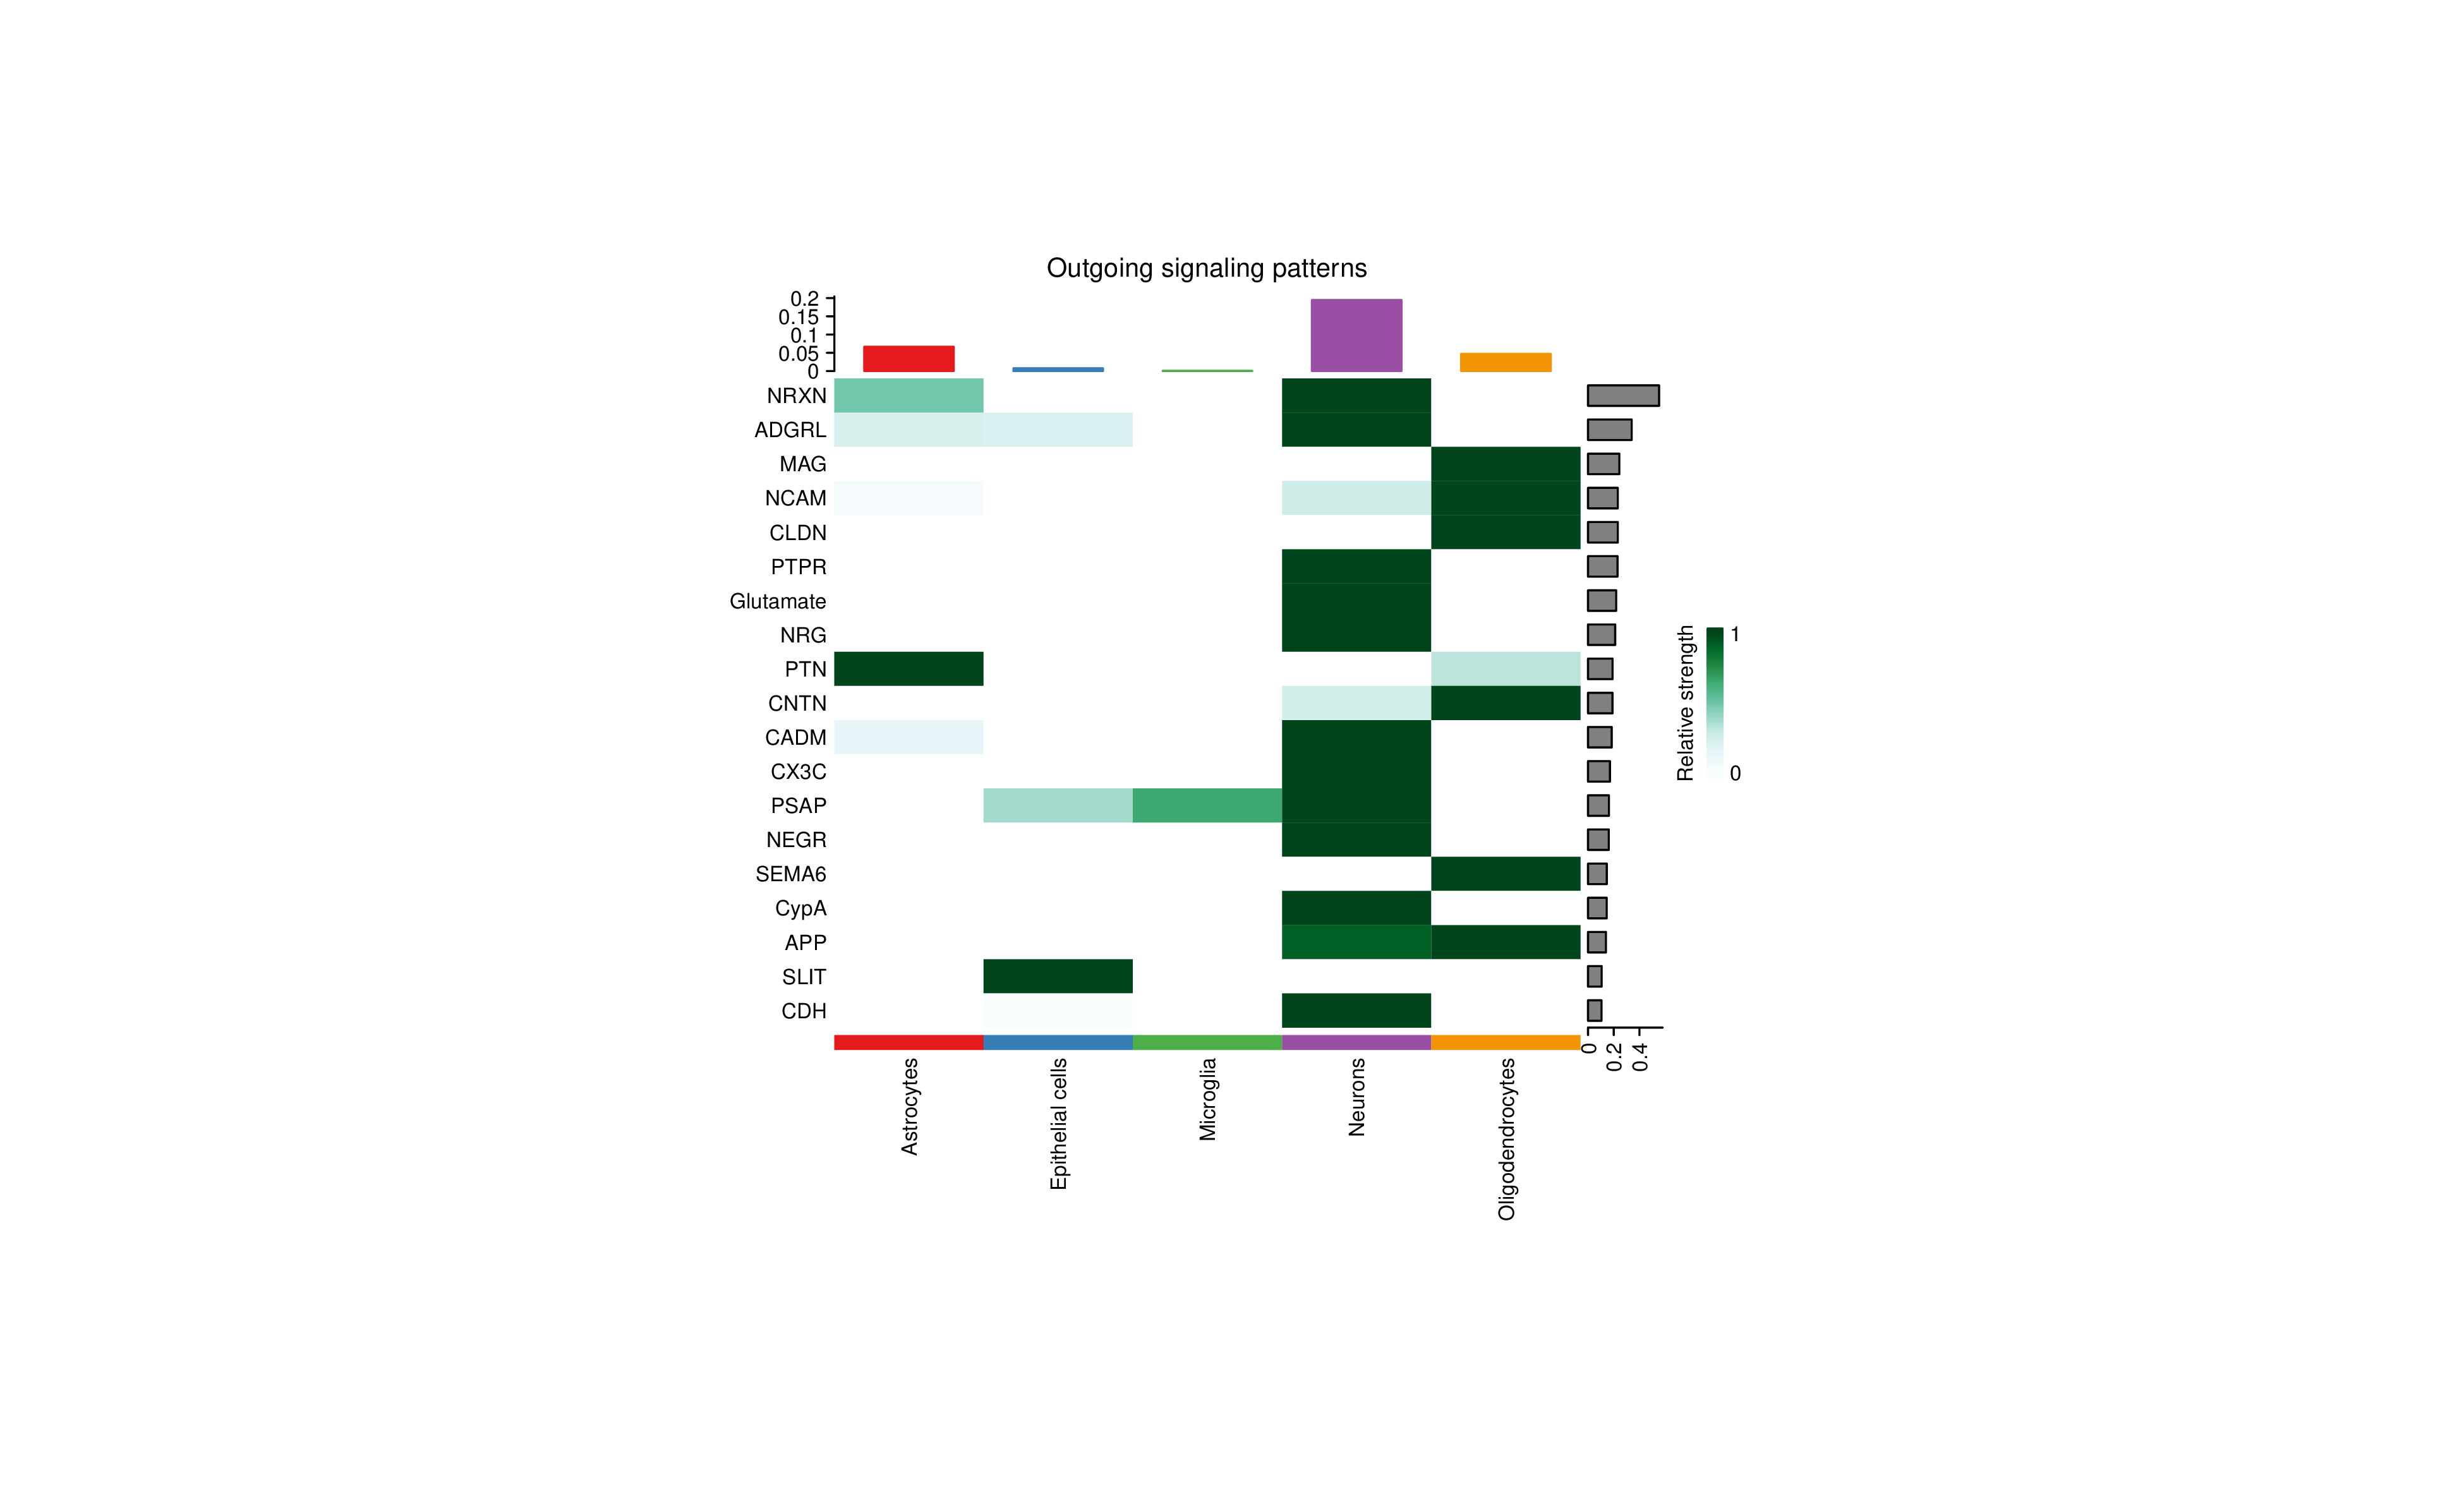
Outgoing Signal Heatmap (Outgoing signaling patterns)
- Rows: Signal pathway names.
- Columns: Cell types.
- Color Intensity: Relative strength of this cell type as signal sender in this pathway.
- Right Bar Chart: Overall strength of each pathway.
- Top Bar Chart: Overall outgoing signal strength of each cell type.
Incoming Signal Heatmap (Incoming signaling patterns)
- Rows: Signal pathway names.
- Columns: Cell types.
- Color Intensity: Relative strength of this cell type as signal receiver in this pathway.
Interpretation Points
- Cell-Specific Signal Pathways: Observe which signal pathways are particularly active in specific cell types.
- Signal Pathway Patterns: Identify cell types with similar signal patterns.
- Key Signal Pathways: Right bar chart shows overall most important signal pathways.
- Sender-Receiver Pairing: Combine outgoing and incoming signal heatmaps to identify sender-receiver pairings.
Spatial Position Communication Visualization
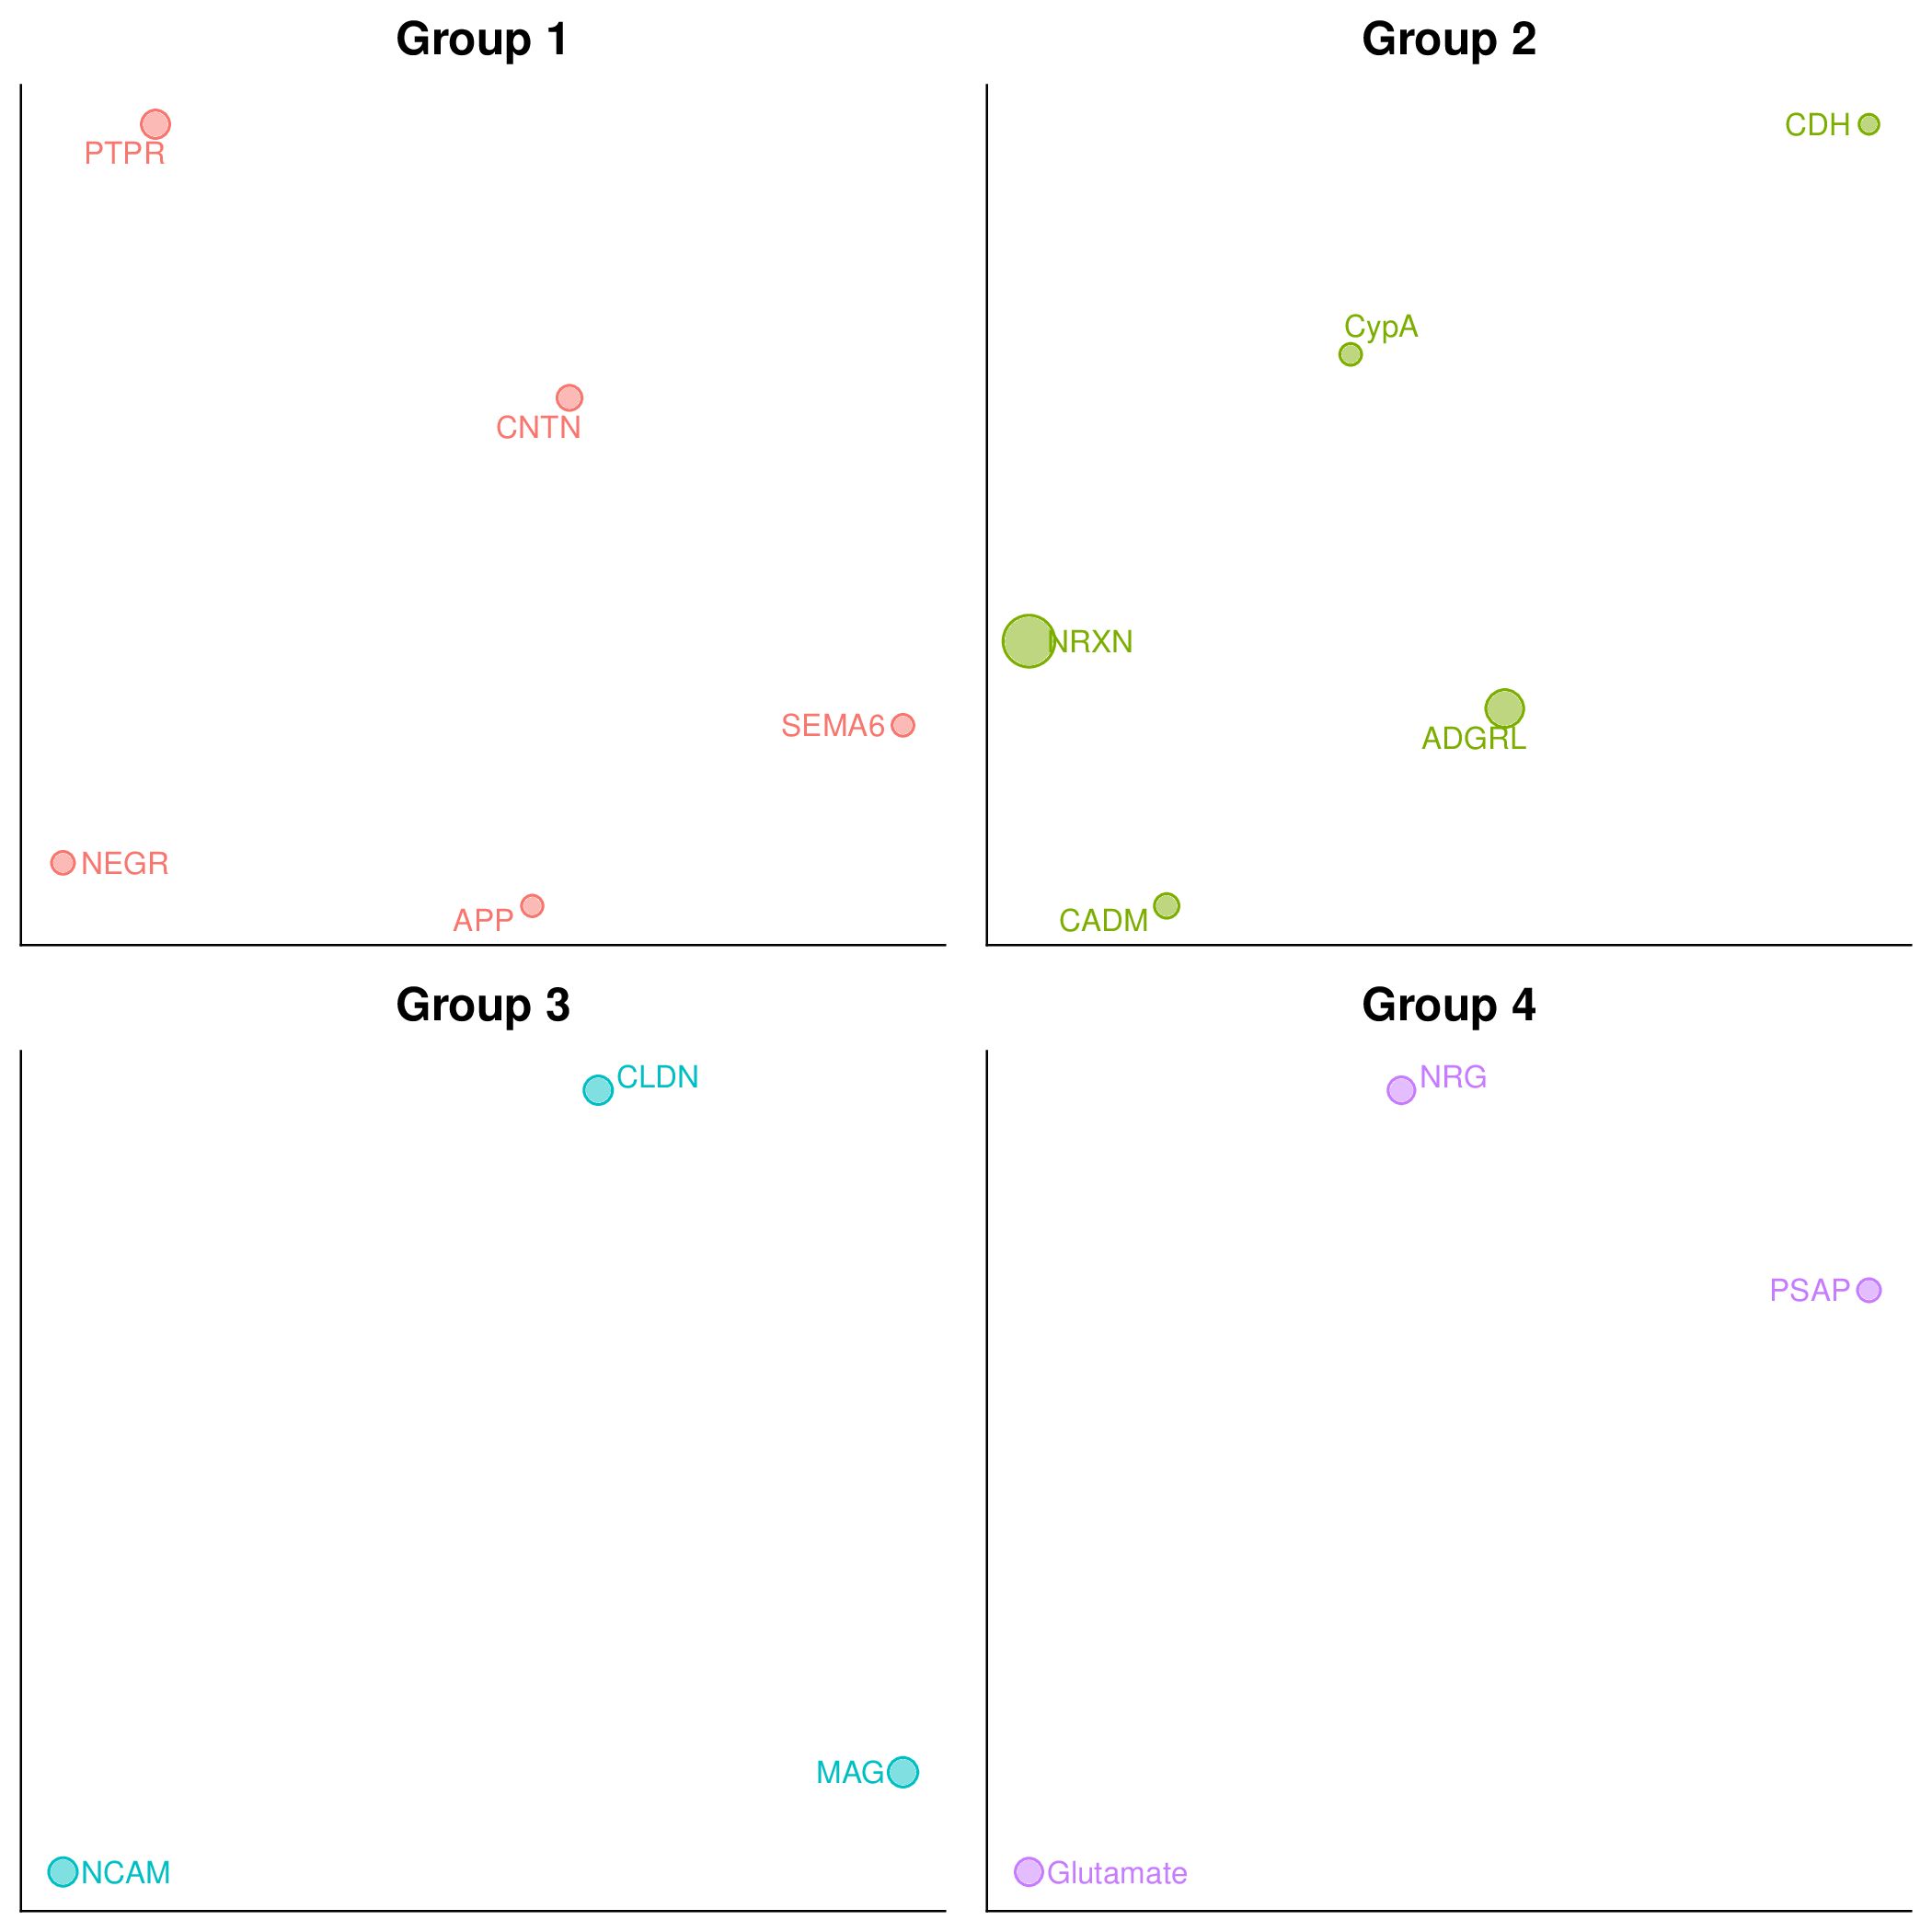
Chart Characteristics
- Background: Displays spatial positions of cells in the tissue.
- Connecting Lines: Indicate communication between spatially proximal cells.
- Color: Distinguishes different cell types or signal strength.
Interpretation Points
- Spatial Patterns: Observe spatial distribution patterns of communication in the tissue.
- Local Microenvironment: Identify cell communication hotspots in specific regions.
- Distance Effect: Verify whether communication conforms to spatial proximity.
Data Table Interpretation
LR_pair Table (Ligand-Receptor Pair Information)
- interaction_name: Ligand-receptor pair name.
- pathway_name: Belonging signal pathway.
- ligand: Ligand gene.
- receptor: Receptor gene.
- source: Signal sender cell type.
- target: Signal receiver cell type.
- prob: Communication probability.
- pval: Statistical significance P-value.
pathway Table (Signal Pathway Information)
- pathway_name: Signal pathway name.
- source: Signal sender cell type.
- target: Signal receiver cell type.
- prob: Total communication probability of this pathway.
- count: Number of ligand-receptor pairs contained in this pathway.
Application Cases
Application of CellChat v2 in Spatial Transcriptomics
- Data Source: CellChat official Nature Protocols article example.
- Background: CellChat v2 is specifically optimized for spatial transcriptomics data, introducing spatial distance factors, enabling more accurate inference of spatially proximal cell-cell communication.
- Analysis Strategy: Use Visium spatial transcriptomics data, integrate spatial coordinate information, set communication distance threshold (interaction.range=250 μm), identify spatially dependent cell communication.
- Core Findings:
- CellChat_spatial can accurately identify spatially proximal cell-cell communication, filtering false positive interactions with large spatial distances.
- By adjusting communication distance thresholds, short-distance (contact-dependent) and long-distance (secretory) signal pathways can be distinguished.
- Spatial position communication visualization intuitively displays spatial distribution patterns of cell communication in tissues.
- Compared to traditional single-cell CellChat analysis, CellChat_spatial provides results more consistent with tissue biology.
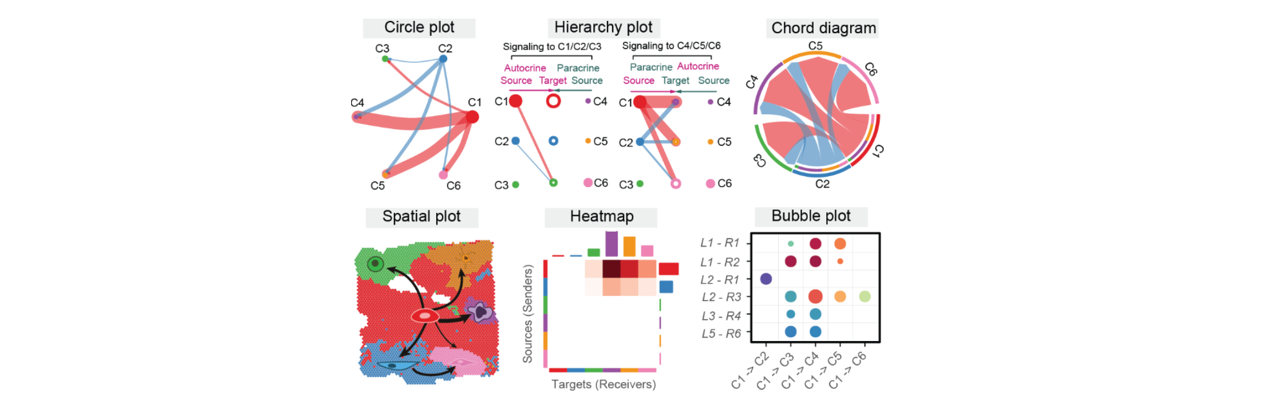
Figure: CellChat analysis workflow. Infers cell-cell communication networks by integrating gene expression data, ligand-receptor databases, and spatial information.
Notes and Best Practices
WARNING
Avoid Overinterpretation: CellChat_spatial results are computational inferences based on gene expression data and spatial positions, not equal to real cell-cell interactions. Any key findings require subsequent biological experiments (such as immunofluorescence co-localization, receptor blocking experiments, etc.) to confirm.
CAUTION
Data Quality is Crucial:
- Spatial Coordinate Accuracy: Deviations in spatial coordinates will lead to incorrect spatial proximity judgments.
- Sequencing Depth: Insufficient sequencing depth will cause ligand/receptor genes to be undetected, producing false negatives.
- Cell Type Annotation: Incorrect cell type annotation will lead to incorrect communication inference.
TIP
Optimize Analysis Results:
- Parameter Tuning: Adjust trim, mincell and other parameters according to data characteristics.
- Biological Validation: Combine known ligand-receptor interaction knowledge to validate results.
- Multi-Method Cross-Validation: Combine other cell communication analysis tools (such as CellPhoneDB, COMMOT) for cross-validation.
- Functional Enrichment Analysis: Perform functional enrichment analysis on identified signal pathways to understand their biological significance.
Result Validation Strategy
Computational Validation
- Consistency Check: Check whether ligands and receptors are expressed in expected cell types.
- Spatial Consistency: Verify whether communicating cells are spatially proximal.
- Statistical Significance: Focus on significant communications with p-value < 0.05.
Literature Validation
- Known Interactions: Consult literature to verify whether identified ligand-receptor pairs have literature support.
- Signal Pathways: Confirm whether signal pathways are known to be active in this tissue/cell type.
- Database Query: Use CellChatDB, UniProt and other databases to validate ligand-receptor interactions.
Experimental Validation
- Immunofluorescence Co-Staining: Validate expression and co-localization of ligand and receptor proteins.
- In Situ Hybridization (ISH): Validate expression patterns of ligand and receptor mRNA.
- Functional Experiments:
- Receptor blocking experiments: Use antibodies or small molecule inhibitors to block receptors.
- Ligand stimulation experiments: Exogenously add ligands to observe downstream effects.
- Gene knockout/knockdown: Validate gene function through CRISPR or RNAi technology.
Frequently Asked Questions (FAQ)
Q1: What is the difference between CellChat_spatial and regular CellChat?
A: Main differences:
- Spatial Information Integration: CellChat_spatial uses cell spatial coordinate information, only considering spatially proximal cell-cell communication.
- Distance Factor: Introduces parameters such as distance.use, interaction.range, adjusting communication probability according to inter-cell distance.
- Contact-Dependent Signals: Can distinguish contact-dependent and secretory signals, more accurately reflecting biological reality.
- Spatial Visualization: Provides spatial position communication visualization, intuitively displaying communication distribution in tissues.
Q2: How long does CellChat_spatial analysis take?
A: Analysis time depends on data size:
- Small datasets (1,000-5,000 cells): 30 minutes - 1 hour.
- Medium datasets (5,000-20,000 cells): 1-3 hours.
- Large datasets (> 20,000 cells): 3-8 hours or longer.
- It is recommended to use the Downsample function for large datasets to accelerate analysis.
Q3: How to set an appropriate interaction.range parameter?
A: Depends on the following factors:
- Spatial Technology Resolution: High-resolution technologies (e.g., MERFISH) use smaller values (50-100 μm), low-resolution technologies (e.g., Visium) use larger values (200-300 μm).
- Tissue Type: Dense tissues (e.g., tumors) use smaller values, loose tissues (e.g., lymph nodes) use larger values.
- Signal Type: Use smaller values for short-distance signals, larger values for long-distance signals.
- Default: In most cases, the default 250 μm is reasonable.
Q4: How to choose between triMean and truncatedMean methods?
A:
- triMean: Stricter, suitable for scenarios requiring high-confidence communication networks, results are more conservative but reliable.
- truncatedMean: Looser, suitable for exploratory analysis, can discover more potential communications, recommended for spatial data.
- Recommendation: Use truncatedMean (trim=0.1) for initial analysis, try triMean if results are too noisy.
Q5: Why are there very few interactions in my results?
A: Possible reasons and solutions:
- Parameters too strict: Lower trim value (e.g., from 0.25 to 0.1), or change triMean to truncatedMean.
- Insufficient cell number: Ensure each cell type has at least 10-20 cells.
- Low sequencing depth: Ligand/receptor gene expression is low and undetected, consider using higher depth data.
- Improper cell type selection: Some cell types inherently have less communication, try analyzing other cell types.
Q6: How to interpret spatial position communication visualization plots?
A:
- Dense connection areas: Indicate active cell communication in this area, possibly a functionally important microenvironment.
- Long-distance connections: May be secretory signals, or check for false positives (adjust interaction.range).
- Connection direction: Observe the spatial propagation direction of signals, identifying signal sources and target regions.
- Combine with cell type distribution: Interpret communication patterns in combination with spatial distribution of cell types.
Q7: What are the data quality requirements for CellChat_spatial?
A: Key requirements include:
- Accurate spatial coordinates: Must have coordinate information in spatial dimensionality reduction.
- Reasonable cell number: Each cell type ≥ 10 cells, total cells ≥ 1000.
- Sufficient sequencing depth: Able to detect expression of ligand and receptor genes.
- Accurate cell type annotation: Accuracy of cell type annotation directly affects result reliability.
Q8: How to perform multi-sample comparative analysis?
A:
- On SeekSoul™ Online, you can select multiple samples in the "Comparison Object" (Group Names) parameter.
- The system will analyze each sample separately and then compare them.
- Results will display the communication network of each sample and the differences between samples.